MNQ EMA 5min
by Peeyush · Verified seller · Listed Jul 2026
Backtest proof
📊 Verified screenshots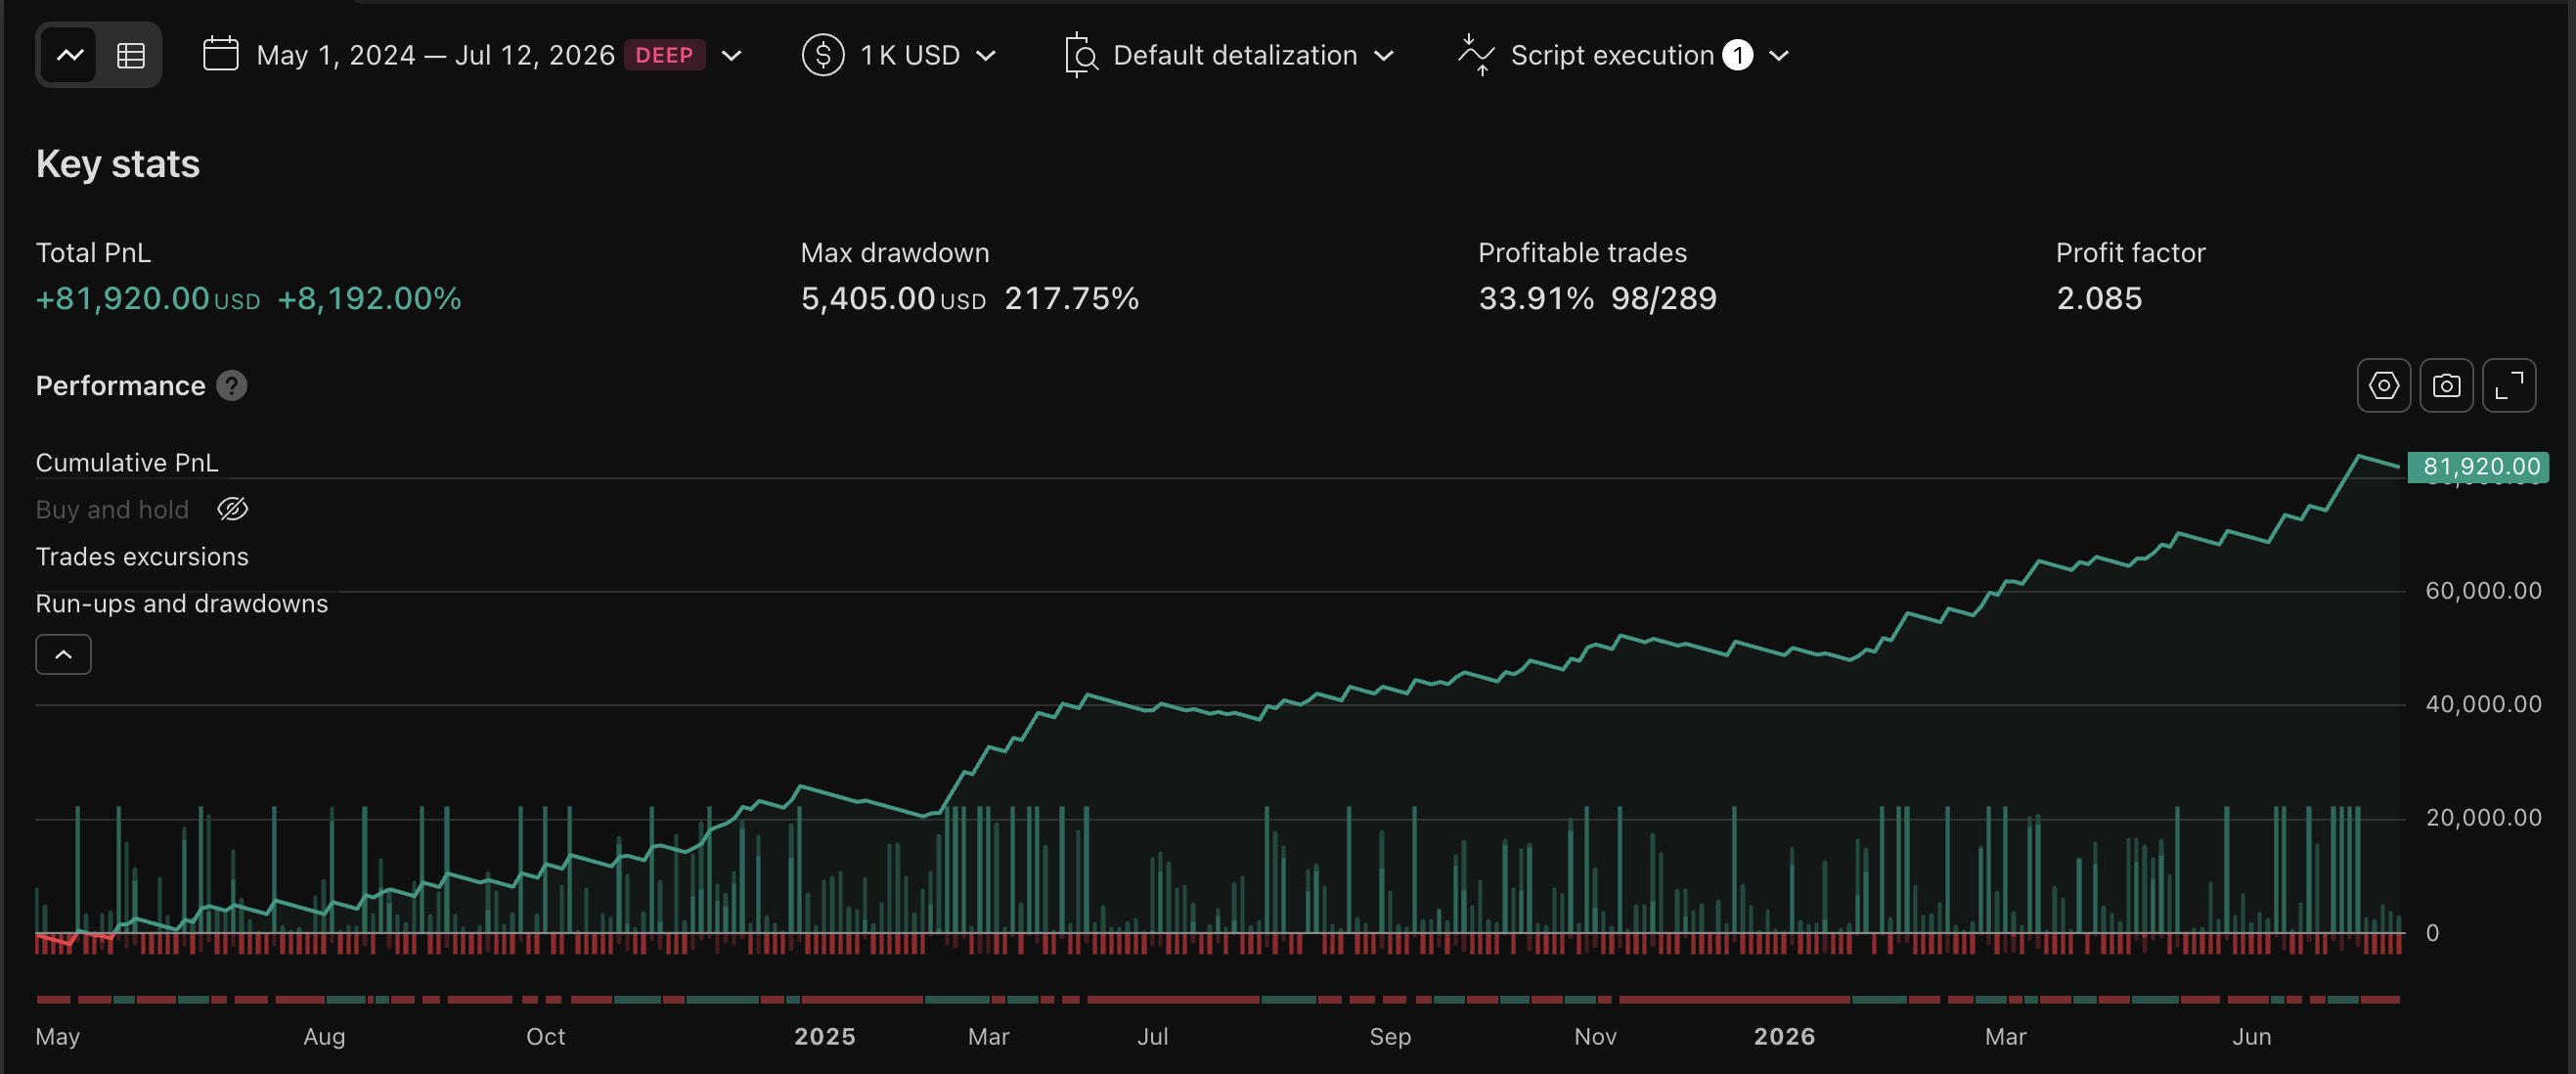
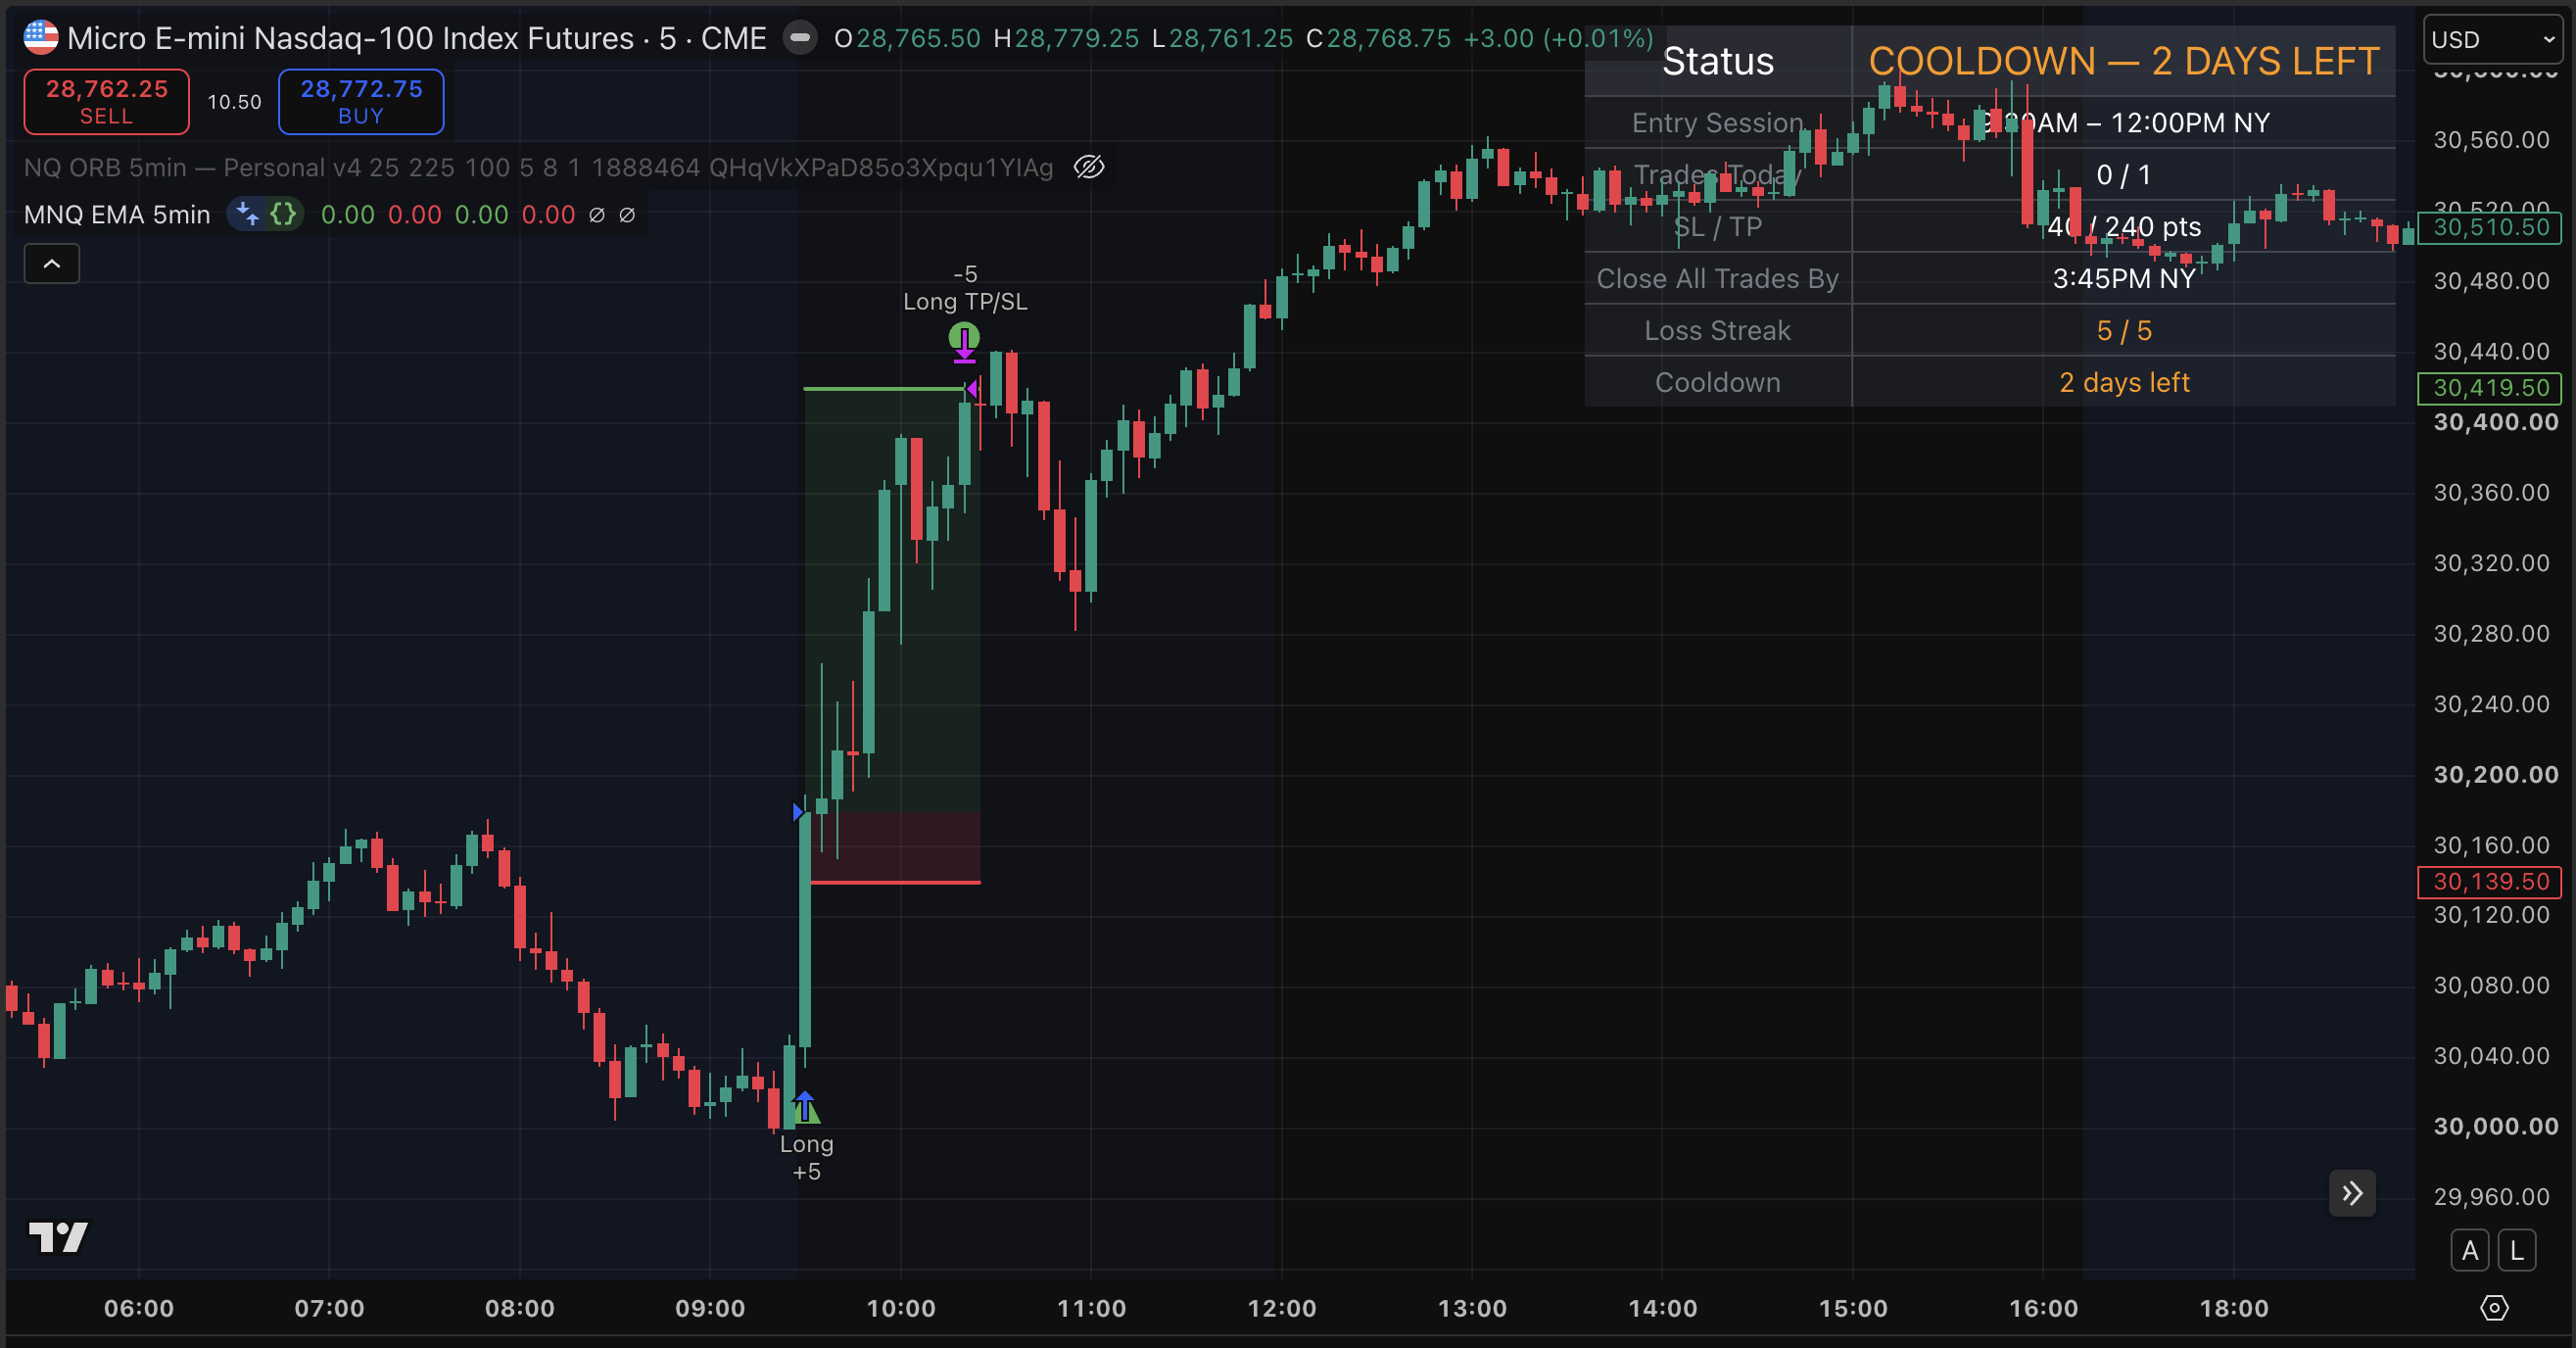
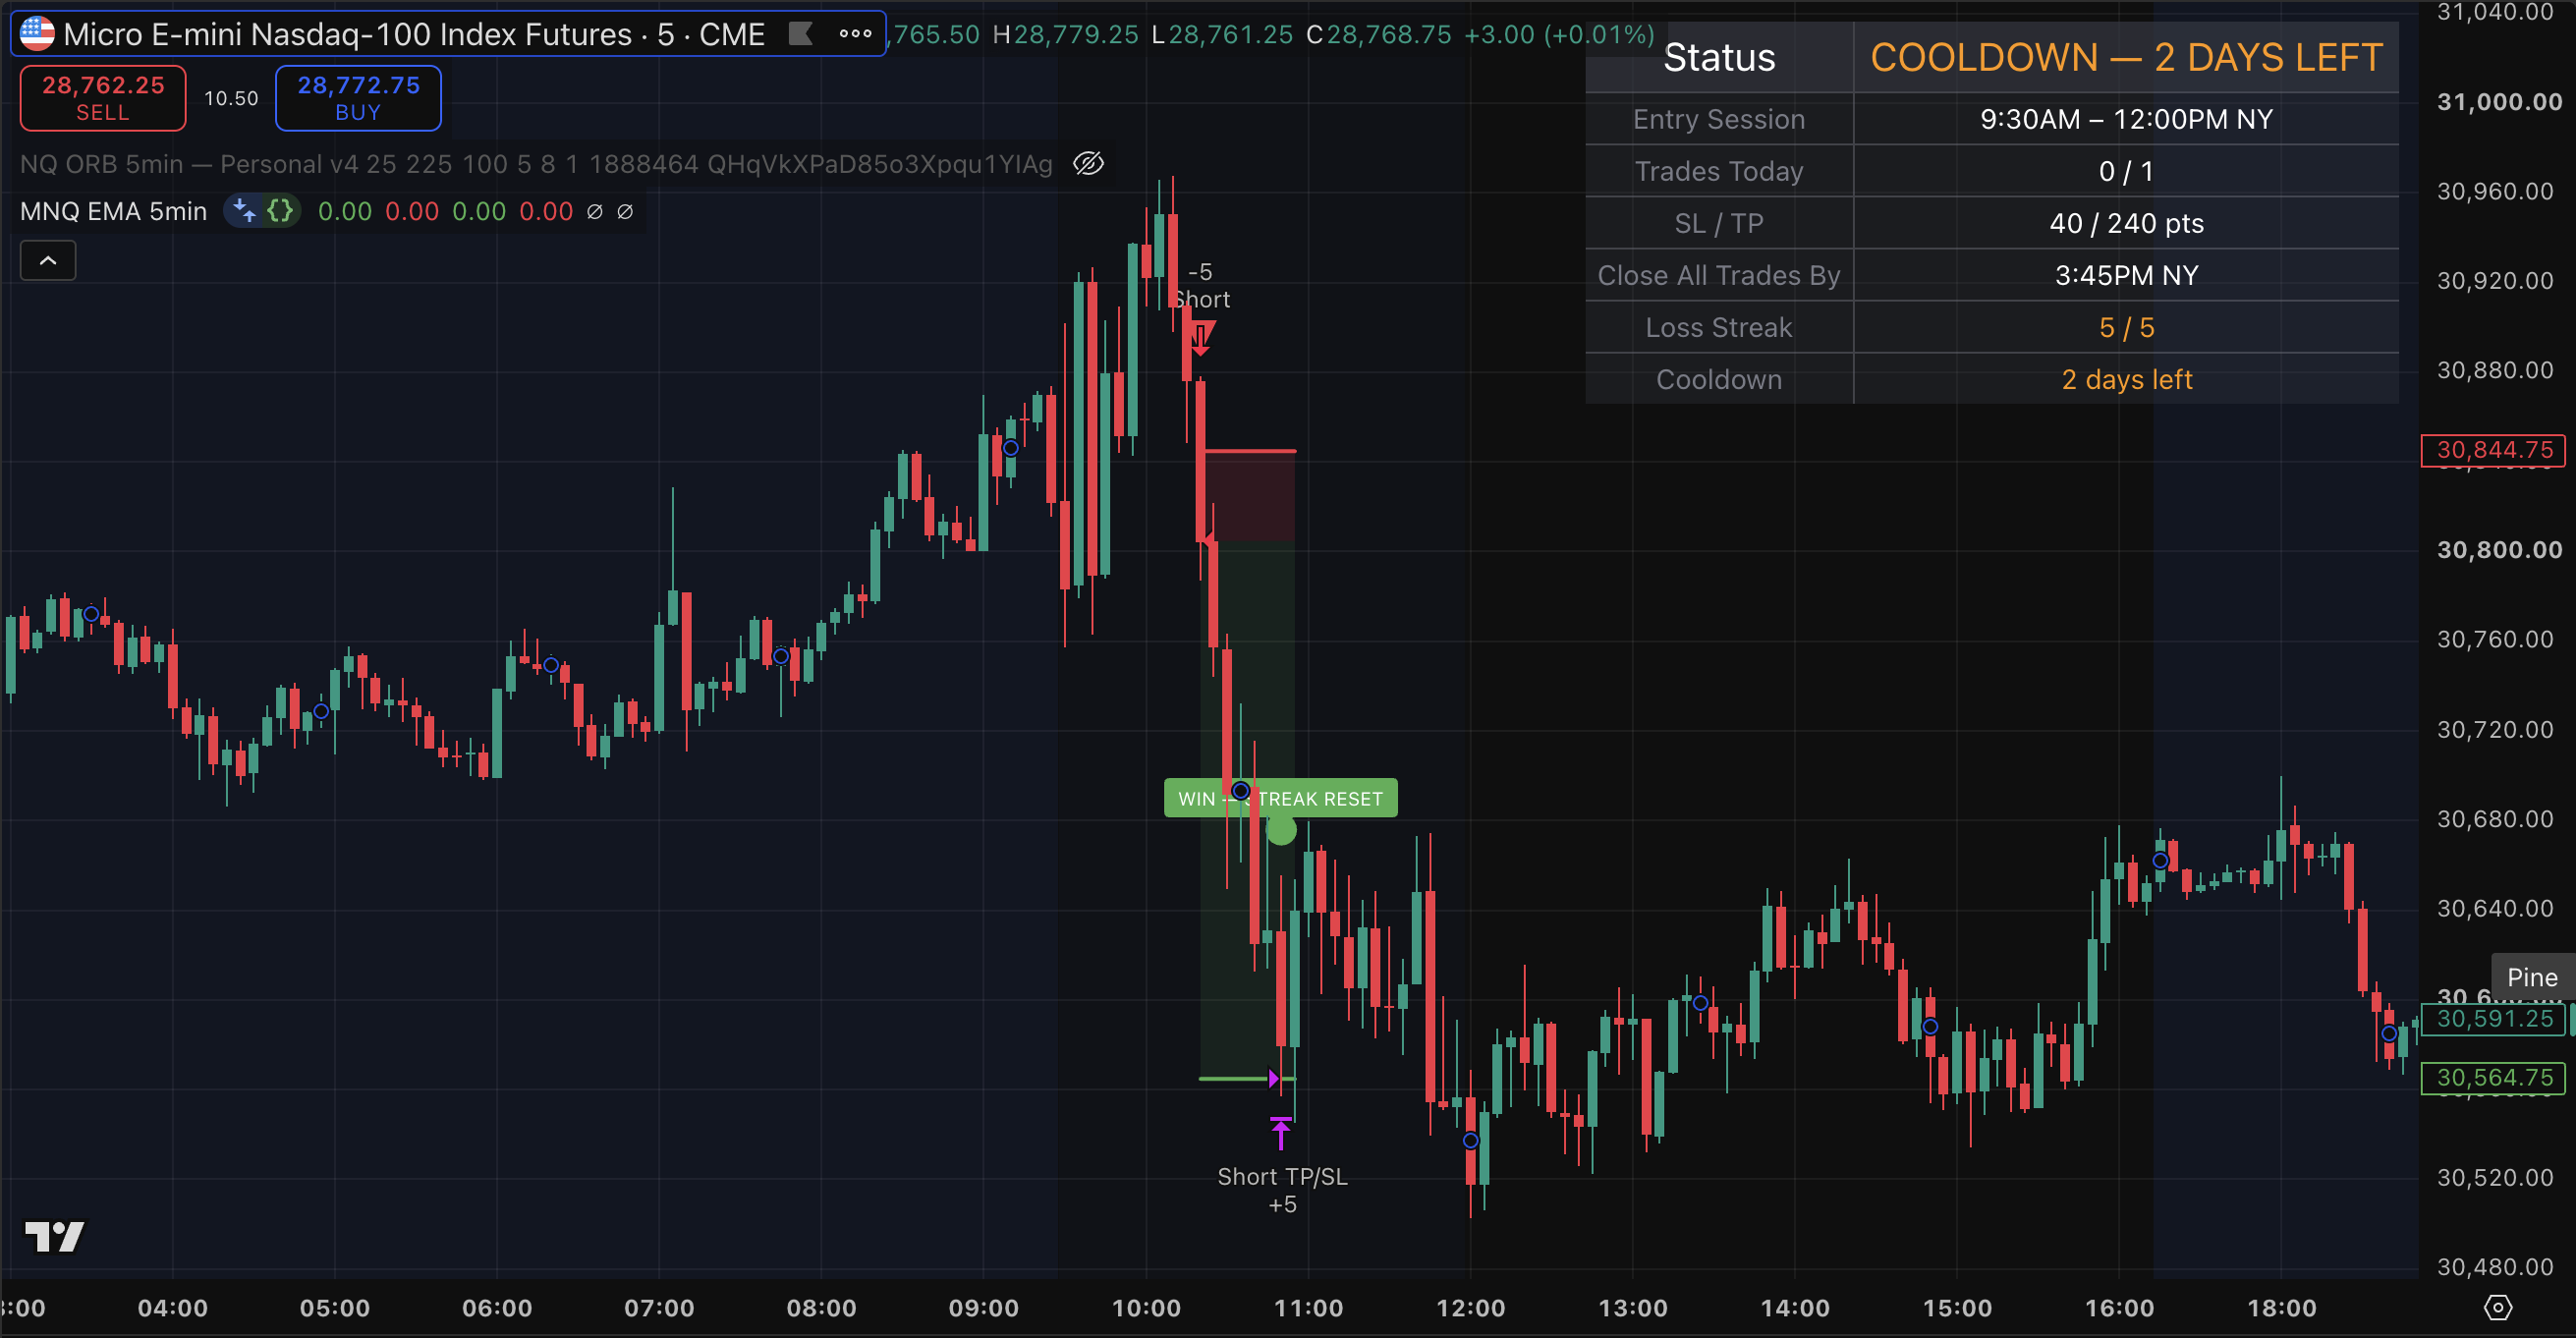
All figures are on a flat 5 MNQ base — no scaling or compounding — and are backtested & simulated, so they are subject to change in live trading.
About this strategy
One clean setup. One trade a day. Zero guesswork. MNQ EMA 5min is a rules-based intraday strategy built for the Micro E-mini Nasdaq-100 (MNQ) on the 5-minute chart. It identifies a specific momentum condition during the morning session and delivers clear, unambiguous signals directly on your TradingView chart — a green arrow to go long, a red arrow to go short. No interpretation required.
Built-in risk management on every trade. Every signal comes with a pre-defined stop loss and profit target of 40 and 240 points, plotted on your chart the moment a trade triggers. You always know your risk before you’re in.
Designed to keep you out of bad conditions. Most traders lose money by overtrading — this system is engineered to do the opposite: a maximum of one trade per day (no revenge trading, no chasing), signals only during the morning session (9:30 AM – 12:00 PM NY) when the setup performs, a proprietary market-condition filter that automatically stands down on days when the environment isn’t right (the chart simply reads “NO TRADE TODAY”), and an automatic cooldown that pauses the system after a losing streak until conditions reset. All positions close by 3:45 PM NY — nothing is ever held overnight.
You always know the system’s status. A live dashboard on your chart shows exactly what’s happening at a glance: READY, IN TRADE, DONE FOR TODAY, or COOLDOWN. Load your chart in the morning and know in two seconds whether today is a trading day. This isn’t a black box you have to babysit — it’s a disciplined framework that removes emotion, limits exposure, and makes the hard decisions automatically.
All performance figures are based on a fixed 5 MNQ base position over the May 2024 – July 2026 backtest, with no scaling.
Daily trading schedule
Here's when to be at your chart and when to walk away. The live dashboard handles everything else.
Monte Carlo simulation
10,000 randomized simulations showing the probability of profit across thousands of possible outcomes.
Backtest details
What's included
- ✓ Protected indicator on TradingView — signals appear automatically on your chart
- ✓ Stop loss and take profit levels shown visually
- ✓ Live status dashboard — READY / IN TRADE / DONE / COOLDOWN
- ✓ Full backtest report with every trade
- ✓ Monte Carlo simulation results
- ✓ TradingView setup walkthrough
- ✓ Funded account compatibility guide
- ✓ Automatic strategy updates
- ✓ 30-day free trial — cancel anytime